Instrumentation and Observability Stack for Production iOS Apps
Structured logging, tracing, and runtime events form a production observability foundation.
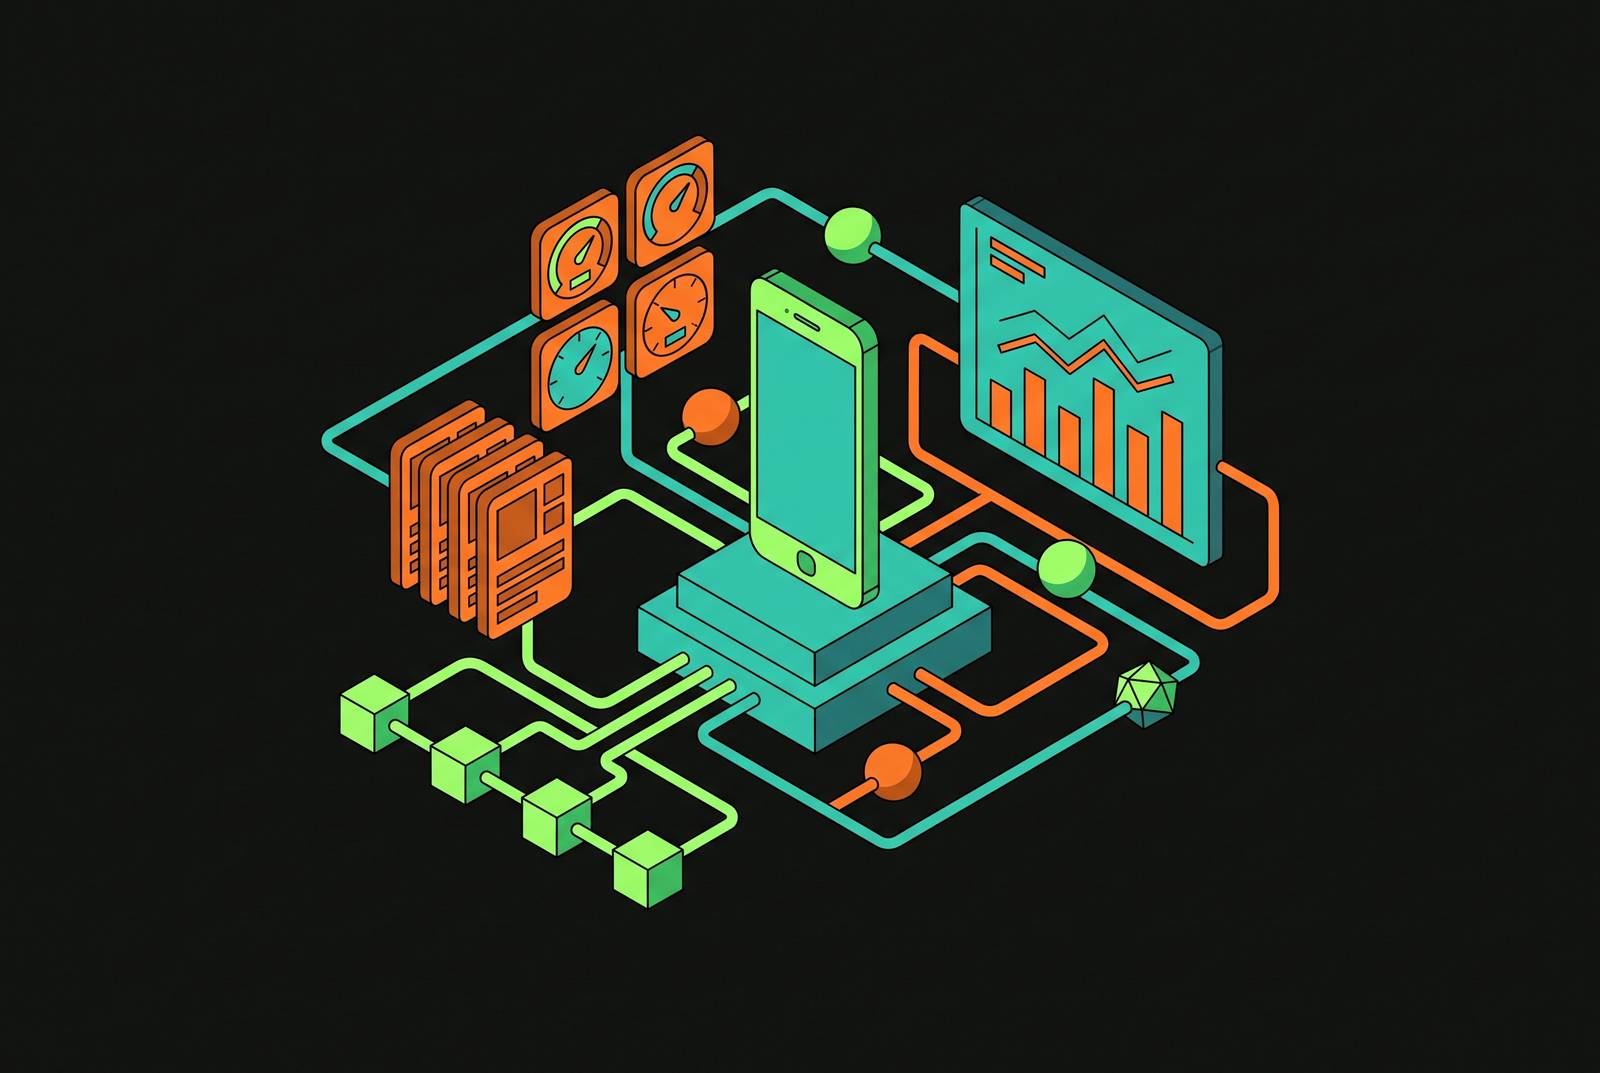
A production iOS observability stack treats the device as a first-class telemetry emitter. Structured OSLog, OpenTelemetry tracing, and automated runtime events form its three layers. Their value comes from correlation and follow-through, with intrusive detection confined to non-production environments so that engineering intelligence does not come at real users’ expense.
Why production iOS apps need more than crash reports and console logs
A crash report identifies where an app died, but it does not explain the journey that preceded the failure. What is missing can include user actions, memory trends, and network state. Console output rarely fills that gap reliably. With logging built from ad-hoc print statements, engineers get pieces instead of a lasting record they can filter, connect, and investigate.
Memory leaks show the same weakness even when the app does not crash. Halodoc’s engineering team documented how a memory leak detector surfaced in-app alerts while tracking, monitoring, and closure still required explicit human intervention. There was no centralized view across builds. A warning could appear during QA and disappear without anyone taking charge or following up. The architecture must handle more than crash diagnosis, because interactions, allocations, and network calls need to become routed signals that reach someone even when no one is watching.
Five design principles that separate a production observability stack from development-time tooling
Halodoc’s pipeline design puts production safety first, and other implementations need to do the same. Runtime detection and enrichment must be gated to non-production builds, QA cycles, and UI automation suites, never affecting real users or production stability. Automation replaces dependence on someone being present. Capture, routing, and escalation must work without someone following up by hand.
Every signal must become a structured, durable event that survives its app session and reaches a queryable store. Grouping and de-duplication must be built in from the start, because repeated alerts erode trust. Actionability is the fifth and final commitment. Each detected event needs visibility, ownership, and traceability rather than a dashboard entry that someone must remember to inspect.
Structured OSLog as the foundation: why Logger(subsystem:category:) is not optional
Logger(subsystem:category:) provides the structured foundation on which the higher layers depend. Distinct categories for networking, persistence, and UI preserve useful boundaries when logs reach Console, CI artifacts, and downstream pipelines. Categories turn output into independently filterable streams. If a background fetch fails, a networking category lets an engineer isolate the events that preceded it.
Print-based logging gives downstream tools none of that structure. Without stable categories and explicit context, its text does not provide a queryable signal or a dependable connection to a trace span. Privacy is part of that structure. OSLog’s .public and .private levels govern whether content can appear in production artifacts, a boundary that becomes especially important when user content or prompts enter the logging path. A useful diagnostic record is not automatically an acceptable disclosure.
MVVM + Coordinators + Dependency Injection gives each layer a natural logging scope, while DI allows a configured Logger to be injected rather than scattering subsystem strings throughout the codebase. Swift 6’s strict concurrency enforcement complements this discipline through Sendable and actor isolation, catching data races at compile time rather than leaving that class of failure to appear as a hard-to-reproduce runtime anomaly. Cleaner concurrency removes ambiguity that more logging alone cannot resolve.
OpenTelemetry tracing on iOS: adding distributed context the device can emit
OSLog describes device-side activity, while OpenTelemetry places that activity inside an operation spanning network calls, backend services, and time. The added dimension is distributed context. A tracer belongs to an instrumentation scope such as networking, persistence, or a feature flow. Its spans contain key-value attributes that survive export and become filterable dimensions in Grafana or another OTLP-compatible backend. This gives downstream investigation more than a sequence of local messages.
The practical integration starts with opentelemetry-swift through SPM. The integration targets are OpenTelemetryApi and OpenTelemetrySdk from opentelemetry-swift-core, plus OpenTelemetryProtocolExporter and OpenTelemetryProtocolExporterHTTP from opentelemetry-swift. An OtlpHttpTraceExporter configured with an endpoint and authentication token routes them to the backend, and Grafana Cloud provides an OTLP sink with a free tier suitable for this integration. The device thus participates directly in the observability system rather than relying on backend telemetry to describe its behavior indirectly.
Processor choice separates a working integration from one suitable for sustained volume. SimpleSpanProcessor is acceptable during development, but it blocks the calling thread. BatchSpanProcessor is the appropriate choice for non-trivial production volume. Once exported into backend storage, structured spans provide a durable record without tying instrumentation to one destination. A team can change the exporter destination without re-instrumenting the app, preserving the event model while changing the infrastructure that receives it.
Automated runtime signals: building a memory leak pipeline that closes its own loop
Halodoc built its memory leak pipeline around a memory leak detector in non-production builds. The detector is always on, requires no parallel trace infrastructure, and surfaces leaks during ordinary development and QA activity. Detection is only the start of the pipeline. Each leak becomes a structured background event enriched with the build, session, and user journey state, so the evidence survives beyond the alert that first exposed it.
Dynatrace receives those events and supplies the backend monitoring layer. Monitoring rules aggregate and de-duplicate leak patterns over time, and when the set alert conditions are met, engineering tickets are created without anyone having to do it by hand. The implementation treats memory leaks as operational signals in the same category as errors, crashes, and latency regressions, giving them a route into engineering work instead of leaving them as local debugging artifacts. This is the concrete difference between awareness and an automated response path.
Xcode Instruments was unsuitable for this particular continuous detection role because it is trace-based, requires parallel execution, and produces large trace collections. The workflow needed lightweight signals throughout normal development and QA. That distinction does not invalidate detailed profiling.
The architecture also keeps the detector replaceable. Event routing, backend ingestion, and alerting logic do not depend on retaining the original leak detection mechanism. The event contract is the durable boundary. The same model can work for ANR detection, frame drop signals, and network reliability events if each runtime condition becomes a structured event without a developer having to watch a screen.
Connecting the layers: how OSLog, OTel spans, and runtime events become one coherent signal
With three separate telemetry streams, engineers still have to piece together an incident by hand. Correlation makes them a stack. A structured log line can include the active trace ID, while a runtime event includes the session identifier that connects it to the same activity. With those relationships available, a backend that supports joins can reconstruct an incident timeline from local logging, distributed execution, and runtime detection.
The span locates activity within an operation, while the session connects observations from the same app journey. Neither relationship can be inferred from proximity alone. A shared session is useful only when the trace can also be associated with it, so correlation depends on preserving the connecting context. This is what allows investigation to move from a log line through its enclosing operation to a leak event that followed.
The access layer can then bring that context into the engineer’s working environment. MCP servers provide a path for querying correlated data directly from an IDE. A query such as “show critical bugs on iOS 17” can bring relevant stack traces, user actions, and context into the editor. The usefulness of that access pattern depends on the underlying records already describing the same incident coherently.
Observability for on-device LLM features: what changes when the model runs on the device
For on-device inference through Foundation Models or Core ML, teams need to know more than how long an operation took. Instrumentation must also establish whether the model received the right context, produced valid output, and consumed acceptable memory. Memory becomes part of the feature’s execution evidence. Quantization lowers weight precision to shrink the model footprint, but the context window still needs to be managed to avoid memory spikes. Instruments retains a clear role here for examining those spikes during development and QA, even though it is not the continuous event pipeline.
OpenTelemetry’s GenAI semantic conventions supply an emerging vocabulary for prompts, completions, tool calls, token spend, and retrieval results. They are at Development stability, so attribute names can change between releases. Teams must pin their instrumentation library versions. This requirement is more than dependency housekeeping, because a changing attribute vocabulary can break the dimensions used to interpret exported events. Standardized tracing does not remove the need to manage the standard’s stability.
Logging prompts and completions must be opt-in and explicitly scoped because prompts frequently contain sensitive user data. The OSLog privacy principle applies here too. Tracing an LLM operation gives no permission to keep everything the model received or generated. The distinction allows operational context to remain useful without treating message capture as an automatic consequence of instrumentation.
With Model Context Protocol, the trace also reaches beyond a single inference call. When specialized agents share context through MCP, the span tree must cross agent boundaries. One user action may call on a financial calculation agent, a logistics agent, and a creative writing agent. A single undifferentiated span would obscure that division of work. The observability layer must represent the agent flow as well as the model operation if it is to explain how the result was produced.
When an app’s on-device agents call external services, backend AI observability shows that part of the work too. Langfuse, Arize Phoenix, LangSmith, Braintrust, and Opik offer options in the OTel GenAI space with differing evaluation, licensing, and deployment trade-offs. Their operating requirements are not interchangeable. Langfuse is permissively licensed, self-hostable, framework-agnostic, and accepts OTel traces, but self-hosting requires ClickHouse, Postgres, Redis, and object storage. LangSmith integrates closely with LangChain and LangGraph for debugging complex agent flows, while remaining closed source and reserving self-hosting for enterprise plans.
What distinguishes a production-grade implementation from a stack that looks right in Xcode
A workflow that relies on attached Instruments sessions loses its ongoing view when nobody is investigating. A pipeline without grouping and de-duplication can instead create a ticket for every leak instance across builds and test cycles. One misses signals, while the other makes them too repetitive to trust.
Misconfiguration can defeat the system before either failure becomes visible. Coding agents such as Cursor, Claude Code, and Codex can use an integration guide to fetch the SDK, wire up triggers, and configure privacy masking, reducing setup errors that cause silent data loss. Dependency choices introduce another failure path. Proprietary SDKs can force re-instrumentation when backends change, while unpinned GenAI instrumentation can break attribute names despite using OTel.
The decisive test is whether a detected signal enters a closed loop. It must become a structured event, reach a backend, pass through aggregation rules, and escalate into a ticket without someone manually moving it between stages. Resolution must remain traceable to the original signal. A stack that stops at capture or display has built an observation surface.