Memory Graph Debugger and Retain Cycle Detection in Swift
Xcode's Memory Graph Debugger turns retain cycle hunting from guesswork into systematic diagnosis.

Memory Graph Debugger and Retain Cycle Detection in Swift means the Memory Graph Debugger is the fastest route from a suspected leak to a confirmed retain cycle in Swift. Reading its object graph correctly, and understanding the ARC mechanics that produce cycles in the first place, turns leak-hunting from guesswork into a repeatable diagnostic process.
Why retain cycles still happen in Swift despite ARC
Automatic Reference Counting tracks how many strong references point to an object and deallocates that object the moment the count drops to zero. A retain cycle breaks this arithmetic: when two or more objects hold strong references to each other, neither reference count ever reaches zero, no matter how far the objects drift from anything the app actually uses. ARC has no mechanism for detecting this on its own. It counts references faithfully; it does not ask whether those references still make sense.
The consequence is quiet at first. deinit never fires on either object, the memory behind them never returns to the system, and the leak grows without any visible signal until the accumulated footprint crosses a threshold and iOS fires a memory warning. If nothing in the app responds to that warning, the operating system kills the process outright, with no exception thrown and no log line pointing at the cause.
Four structural patterns account for most cycles seen in real codebases: closures that capture self strongly, delegate properties left as strong references instead of weak ones, Timer instances holding a strong reference to their target, and notification observers that are registered but never removed⟚c3. Each one follows the same shape: an object reaches out to hold onto something that, directly or indirectly, holds onto it back.
SwiftUI does not eliminate this class of problem: SwiftUI views are value types with no reference counting, but @StateObject, @ObservedObject, and closures inside view models all use ARC and can form cycles the same way, so leaks in a SwiftUI app typically live in ObservableObject classes rather than the views themselves. They live in the ObservableObject classes sitting behind it, which is exactly where a developer accustomed to thinking of SwiftUI as "memory-safe by design" is least likely to look.
C|Reading the Memory Graph Debugger
The Memory Graph Debugger takes a snapshot of every object alive on the heap at a given instant, along with every reference connecting them, and pauses the running app so that picture holds still long enough to inspect. It sits in Xcode's debug bar as a small three-circle icon between the view debugger and the location simulator controls.
The interface splits into three panels, and each one answers a different question. The navigator on the left lists every live object type with an instance count beside it: MainViewController (1) means exactly one instance of that controller exists in memory at the moment the snapshot was taken. The center panel draws the actual graph, rendering the selected object as a node with arrows pointing to whatever holds a reference to it. Solid, bold arrows mean strong references; lighter, dashed lines mean weak or unknown ones. The inspector on the right fills in the specifics: class name, memory address, size in bytes, current reference count, and, when Malloc Stack Logging is turned on, the full allocation backtrace showing where that object was created.
Turning on that backtrace takes one extra step before capturing anything. In the scheme's Run settings, under the Diagnostics tab, checking "Malloc Stack" and selecting "Live Allocations Only" keeps the logging overhead from swamping the session while still attaching a backtrace to every allocation shown in the inspector.
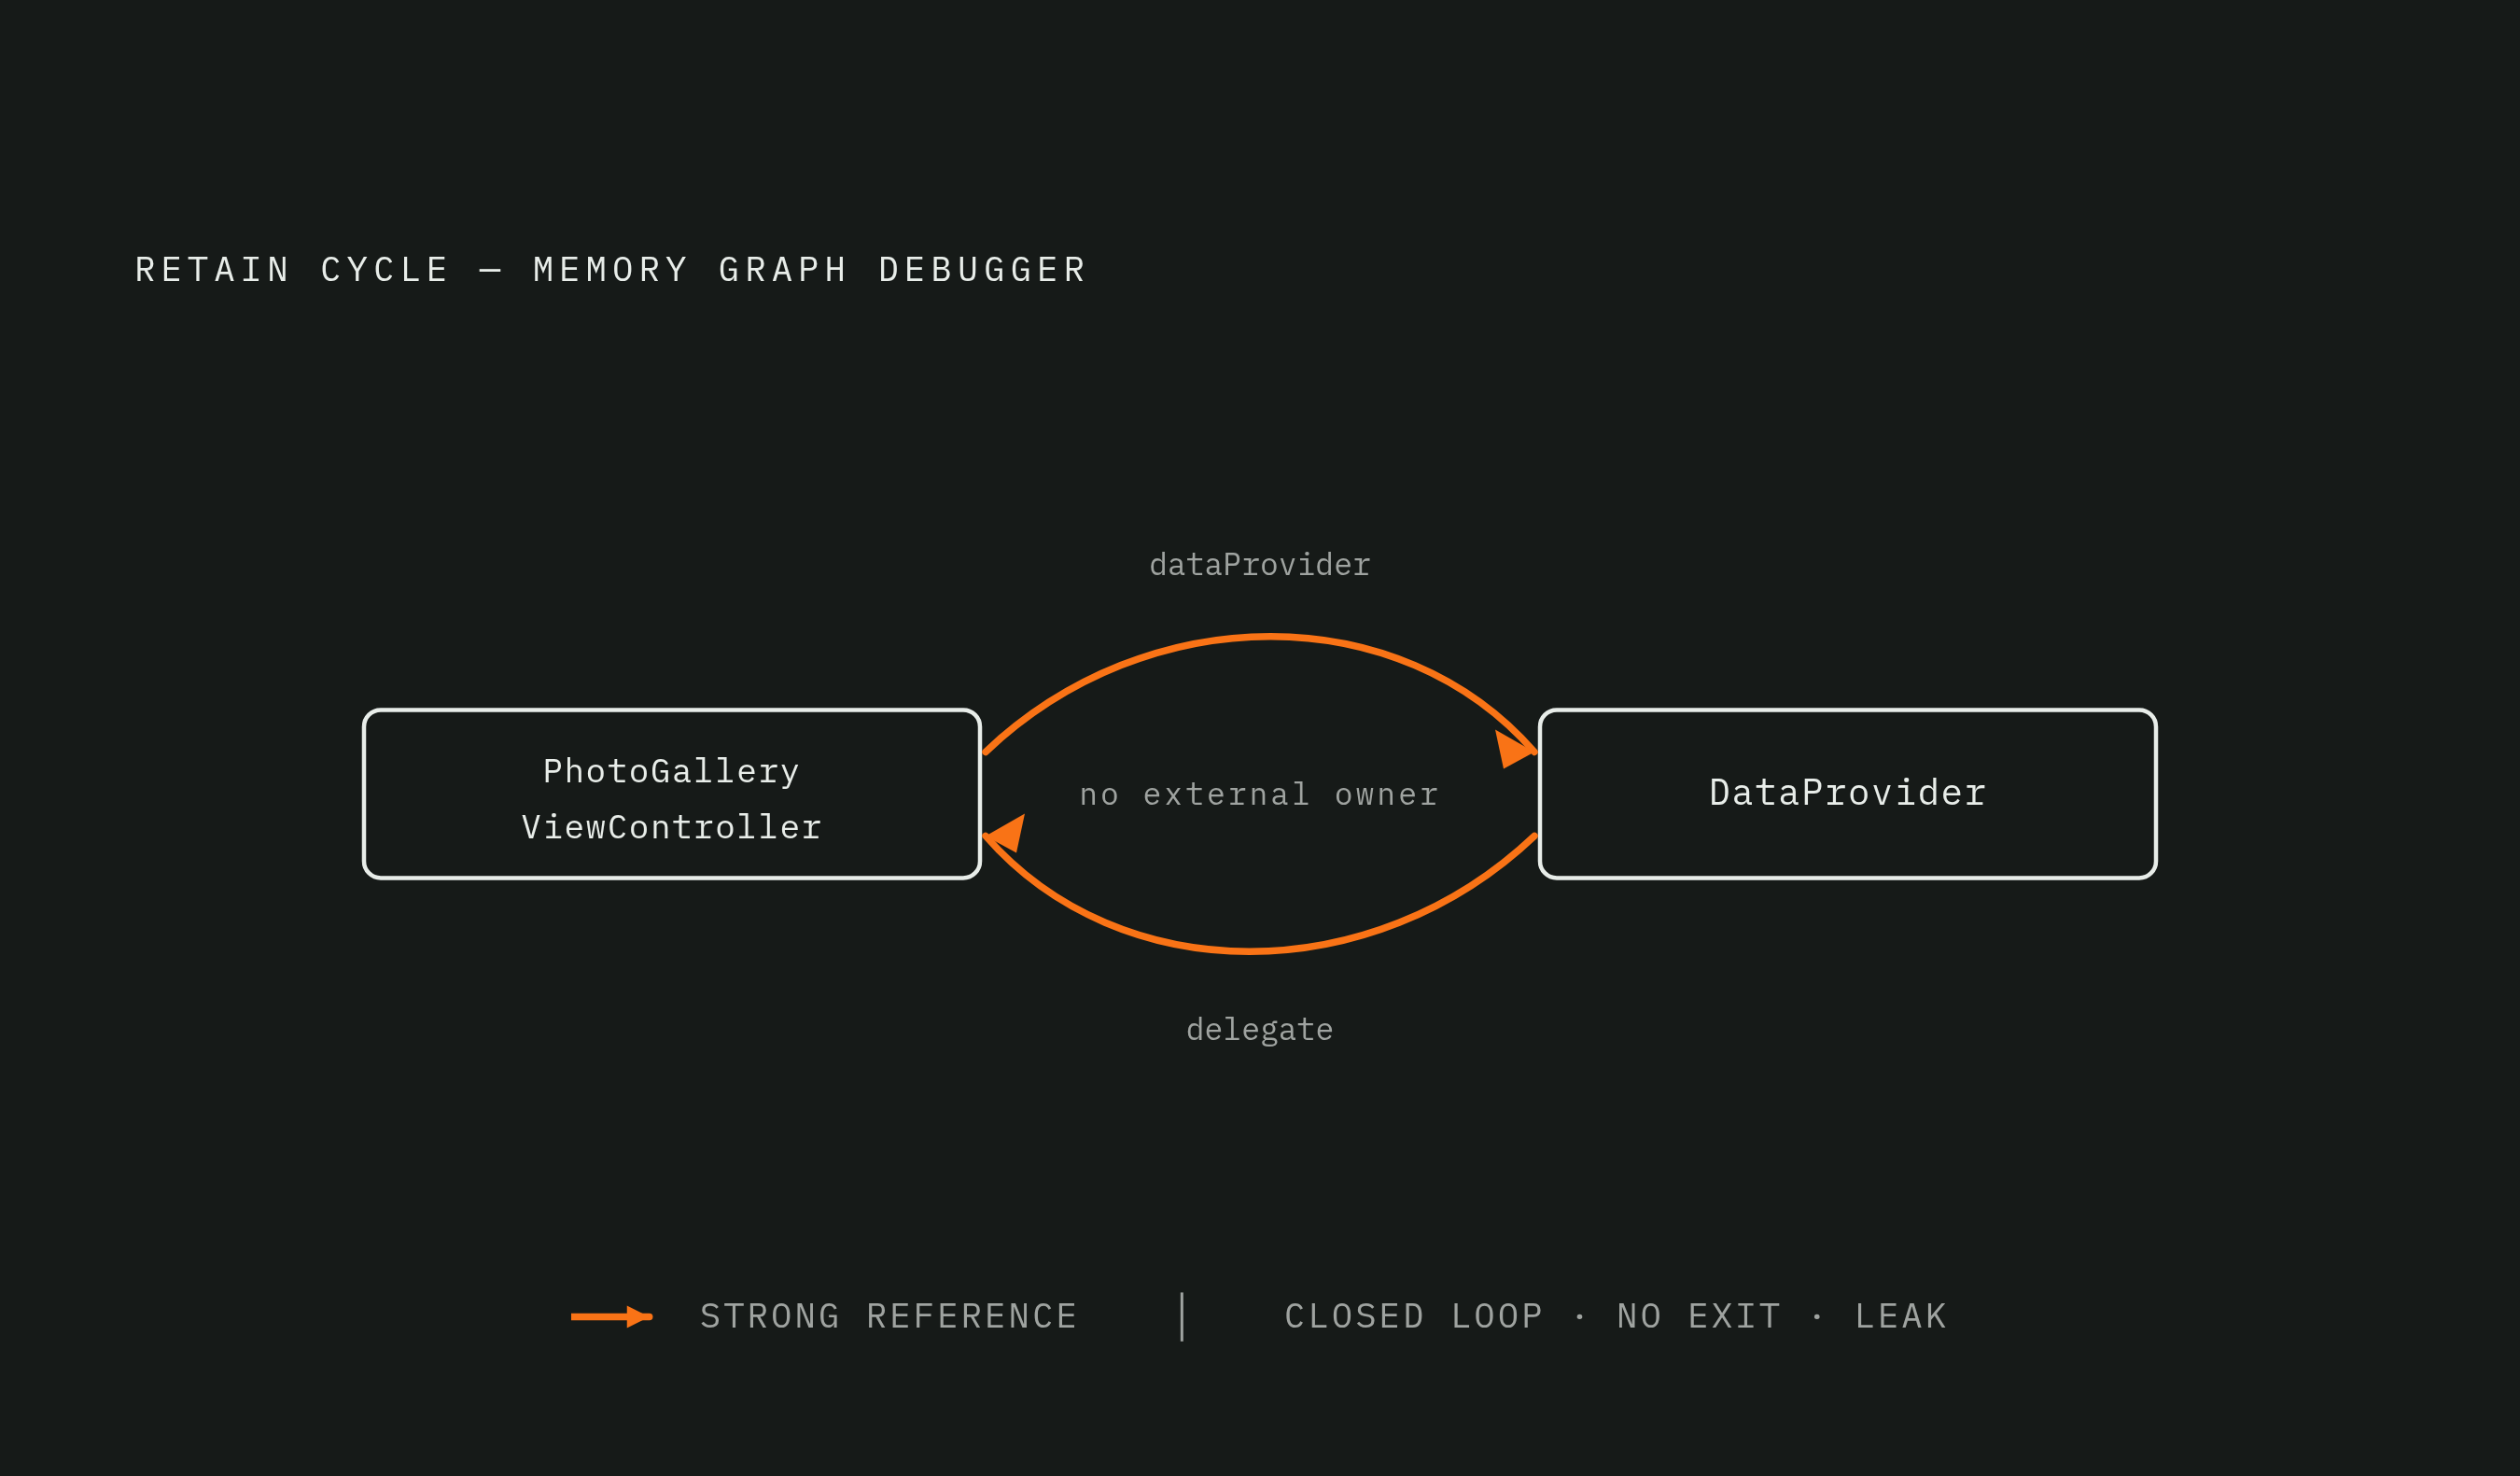
A concrete case makes the visual language easier to recognize. Picture a DataProvider holding a strong var controller: PhotoGalleryViewController?, while that same view controller holds a strong reference back to its DataProvider. B|Picturing this in the graph, two nodes appear with solid arrows pointing at each other, a closed loop with no gap. That loop is the entire signature of a retain cycle rendered visually: no third object, no external owner, just two nodes pointing back at each other forever.
Purple exclamation marks next to an object in the navigator flag Xcode's own suspicion that something has outlived its usefulness. G|Treat that mark as a lead, not a verdict, because Xcode's automatic detection misses real leaks routinely and clearing every purple flag does not mean the graph is clean. The graph also has a directional limit: selecting an object shows what is holding onto it, not what it holds onto in turn, so confirming a full cycle means clicking through each participant one at a time rather than expecting one selection to reveal the whole loop. Filter controls at the bottom of the navigator help cut the noise, narrowing the view to leaked blocks only, or to objects that originate in the workspace rather than in Apple's own frameworks.
A repeatable workflow for catching cycles before they reach production
A single snapshot rarely proves anything on its own. The reliable method compares instance counts across several snapshots taken while deliberately repeating the same user action, because a cycle reveals itself through accumulation, not through any one frame.
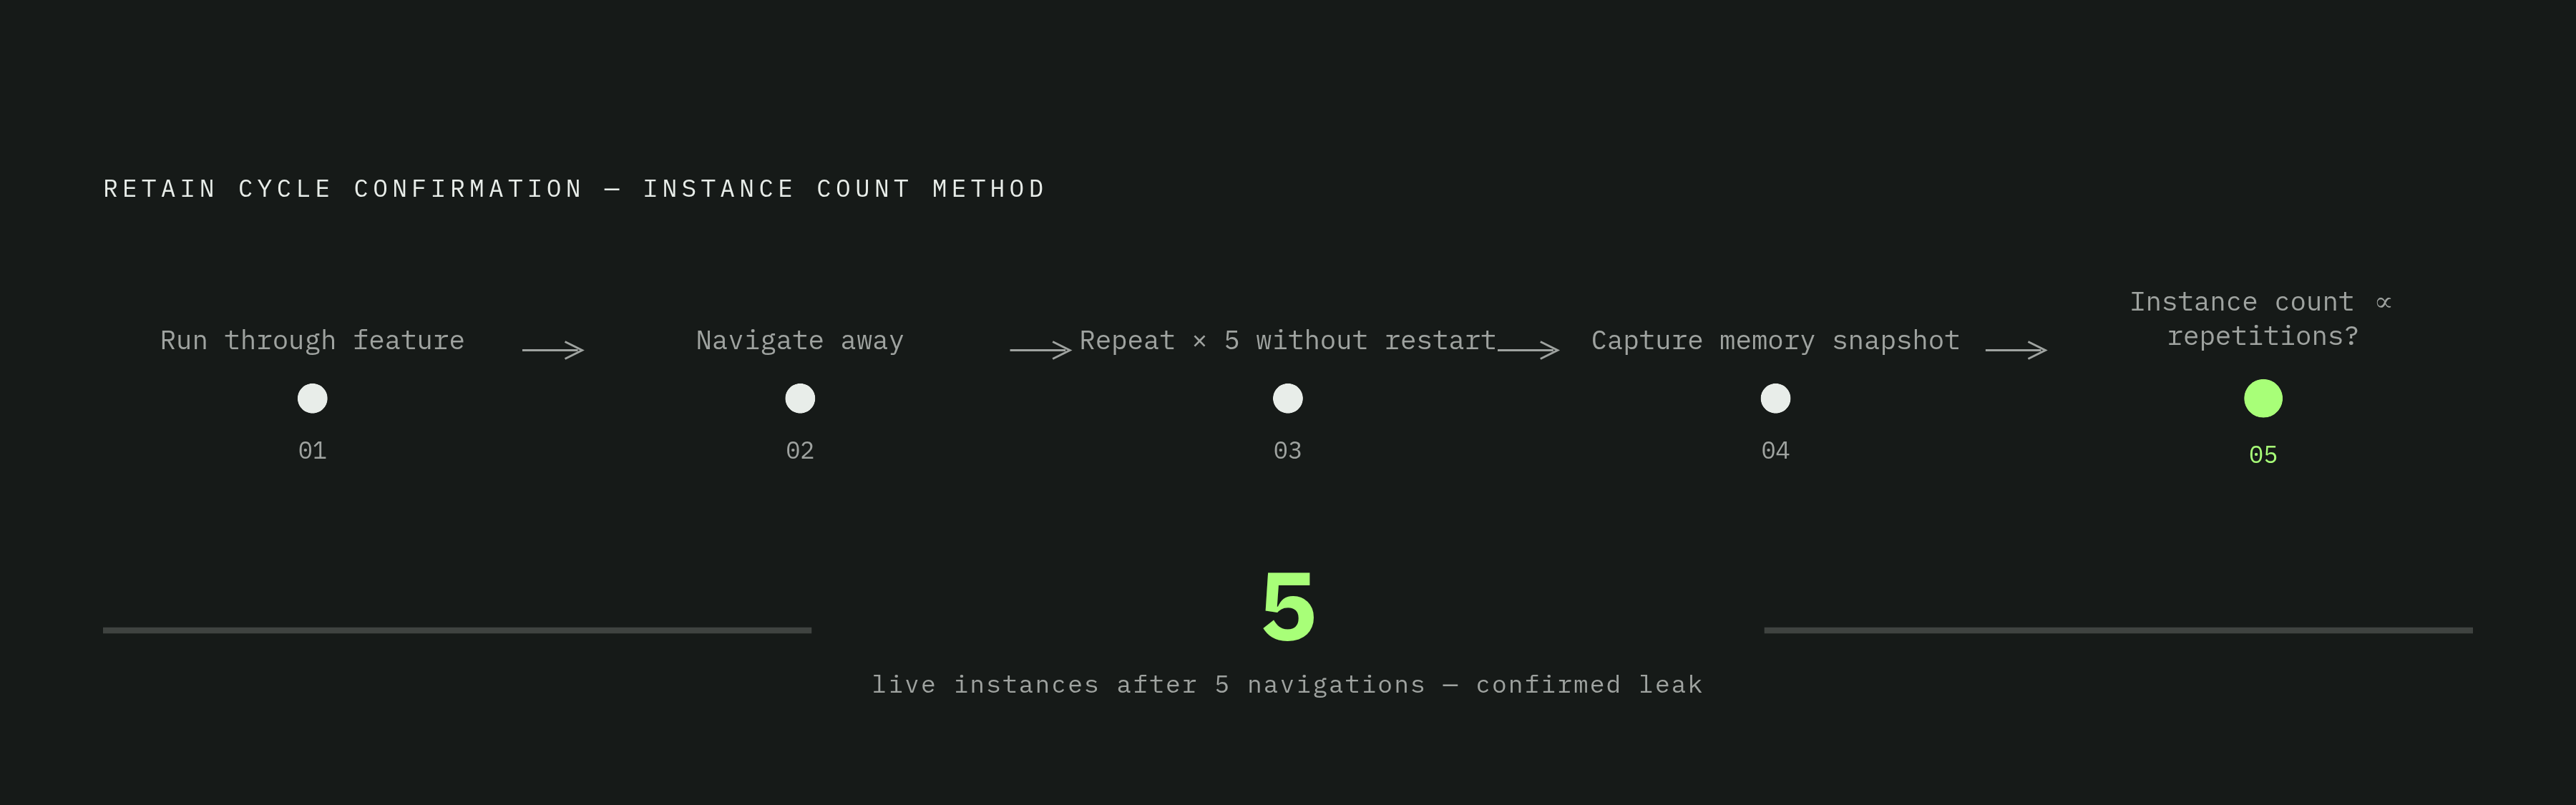
H|The loop itself is simple to run and easy to skip under deadline pressure. It needs to be habitual rather than optional. Run through a feature and navigate away from it. Repeat that same flow several times in a row without restarting the app. Capture a memory snapshot. Then check whether any instance count has grown in proportion to how many times the flow ran.
That last check is where suspicion turns into proof. A view controller that ought to deallocate the moment it's dismissed but shows five live instances after five navigations back and forth is not a maybe. J|It's a confirmed leak, and the number of repetitions tells the engineer how much memory each pass through the flow is costing.
Beyond the manual loop, Apple's own approach folds memory checking into the test suite itself: an XCTest performance test attached to a new feature can monitor memory metrics against a set baseline, catching regressions automatically rather than waiting for a person to notice. Complementary command-line tools that ship with Xcode, leaks, heap, vmmap, and malloc_history, can analyze Simulator processes or already-captured memory graph files, useful when a full Xcode UI session is impractical.
B|Canary objects placed in critical paths, built to report when they fail to deallocate, create a shared, reviewable standard that catches leaks in automated UI test runs rather than during individual developer sessions.
K|Tracing a cycle from the graph back to the code that causes it
Confirming a cycle in the graph is only half the job. The graph has to map back onto an actual line of Swift, and the delegate pattern is the clearest place to watch that mapping happen. Clicking through each node in the loop, one after another, shows which object holds a strong reference to which, and the cycle confirms itself the moment the chain of arrows returns to where it started.
Returning to the DataProvider and PhotoGalleryViewController case: the fix is to change the property to weak var controller: PhotoGalleryViewController?. A weak reference doesn't add to the retain count, so once nothing else in the app is holding a strong reference to the view controller, it deallocates normally.
There's a compiler detail here that separates an engineer who has actually used this tool from one who has only read about it. If the delegate's type is a protocol rather than a concrete class, weak var will not compile until that protocol is constrained to AnyObject in its declaration. Engineers who hit that compiler error under time pressure sometimes just delete the weak keyword to make the error go away. That doesn't fix anything: it restores the strong reference and puts the cycle right back. The correct fix adds : AnyObject to the protocol definition, which is what actually allows the weak reference to compile and hold.
A harder category of cycle hides behind architectural layering rather than a single missing keyword. A documented production case built on the Clean Swift pattern formed a cycle across a View, an Interactor, and a Presenter, because the Presenter's reference to its View was never marked weak. Nothing about that chain looked wrong in code review. The protocol boundaries between layers made the strong reference invisible to anyone reading the interfaces in isolation, and it only became obvious the moment the Memory Graph Debugger rendered the loop directly.
Closures follow the identical logic with a different syntax. A closure stored on a class, which itself captures self strongly, produces the same loop as any delegate cycle, and the fix is a [weak self] or [unowned self] capture list at the point the closure is defined. Choosing between the two comes down to one question: does the captured object's lifetime match the referencing object's lifetime, provably, in every case? weak makes the reference optional and sets it to nil automatically once the referenced object deallocates, which makes it safe regardless of how the two lifetimes actually relate. unowned skips that safety, and if the guarantee doesn't hold, accessing the reference after deallocation crashes the app outright. The safer default is weak, reserving unowned for cases where the lifetime relationship is guaranteed rather than assumed.
Once a fix lands, the verification step is just the workflow from the previous section run again: repeat the same navigation, capture a fresh snapshot, and confirm the instance count has dropped back to what it should be, with the purple exclamation marks gone.
Where third-party tools fit alongside the Memory Graph Debugger
The Memory Graph Debugger's biggest limitation isn't accuracy, it's timing. It only shows what's happening at the exact instant a developer chooses to take a snapshot, and it has no presence at all in a production build watching for cycles on a user's device. That gap is where a small set of complementary tools earns a place in the workflow, each covering a different stage rather than competing to replace the graph itself.
H|Facebook's FBRetainCycleDetector works by inspecting the Objective-C runtime. It loses most of its usefulness against a codebase written in pure Swift, an increasingly common situation as older projects finish their migration away from Objective-C. LifetimeTracker, built by Krzysztof Zabłocki, takes a plainer approach: it tracks how long objects were expected to live and reports the ones that outlive that expectation, working across both Objective-C and Swift without any hidden runtime trickery. It runs continuously during development, which is exactly the gap the Memory Graph Debugger's snapshot-based model leaves open.
Halodoc's production workflow illustrates what combining these tools actually looks like in practice: the Memory Graph Debugger and Instruments for direct investigation, MLeaksFinder for runtime detection, and SwiftLint rules enforcing weak and unowned usage at the point of code review, before anyone even needs to open a debugging tool. That last piece matters as much as any of the runtime tooling. A SwiftLint rule that flags a delegate property missing weak catches the mistake before it's ever committed, turning a debugging problem into a code review comment instead.
K|On-device AI features and memory discipline
On-device large language models make RAM discipline a hard functional requirement rather than a background concern. Fitting model weights onto a phone requires quantization to shrink them down to what the hardware can actually hold, and a retain cycle inside a session-managing class can prevent that model from releasing memory between inference calls, exhausting the available RAM almost immediately. A leak that would cause a slow, tolerable memory creep in an ordinary app becomes an immediate functional failure once a multi-gigabyte model is involved.
Apple's Foundation Models framework provides Swift-native sessions with guided generation, tool calling, and streaming output, built to take advantage of the unified memory architecture and Neural Engine on Apple silicon. None of that architectural optimization changes what happens when an object is retained past its useful life. A well-designed inference framework cannot compensate for retained objects that are never deallocated.
The current developer-facing shape of Apple's AI stack has three pieces: the Foundation Models framework running inference on-device, App Intents exposing what an app can do to the AI layer, and Private Cloud Compute picking up tasks too large to run locally. Swift 6's strict concurrency model is the recommended way to keep the heavy lifting that inference requires off the main thread, and this is where retain cycle risk picks up a new wrinkle. Actor isolation under Swift 6 introduces reference patterns that don't look anything like a classic delegate or closure cycle, and an engineer comfortable with ARC but new to structured concurrency may not recognize one when it forms.
The practical upshot: session objects, model handles, and tool-calling closures all participate in the same reference graph as any ordinary class, and they need the same Memory Graph Debugger workflow applied to them. Apple's current developer-facing AI architecture combines three components. It's the same discipline, applied to objects that happen to be a lot less forgiving when it fails.
D|Where the workflow breaks down
A clean-looking snapshot is not proof of a clean codebase, and treating it as one is the most common mistake engineers make with this tool. Xcode's automatic detection misses real cycles routinely, and any cycle it misses simply won't show a purple flag, leaving manual graph navigation as the only way to catch it.
Timing compounds the problem. A snapshot only captures what exists at the exact moment it's taken, so a cycle that only forms under specific navigation sequences or specific concurrency timing may be completely absent from a snapshot taken right at launch. E|That's the real justification for the repeated-flow workflow covered earlier: forcing a timing-dependent cycle into view has no other reliable method.
Project structure introduces its own friction. Swift Package Manager targets that don't run through a standard Xcode project need their binary re-signed with the com.apple.security.get-task-allow entitlement before the Memory Graph Debugger will attach at all. Without that step, the debugger fails with an "Unable to acquire required task port" error, a failure mode documented on the Swift Forums along with a confirmed workaround.
Cross-platform frameworks lose the most. The Memory Graph Debugger reaches full fidelity only against native processes, so debugging memory in a React Native app means switching between browser developer tools, Xcode, and Android Studio, with no single unified graph tying the pieces together. For engineering leaders picking a framework, that fragmentation is a real operational cost, not a footnote: it means memory debugging on a cross-platform app takes longer, requires more tools, and gives less confidence in the result than the same investigation would on a fully native target.
Sources
- Using Xcode’s memory graph to find memory leaks – Donny Wals
- How to detect iOS memory leaks and retain cycles using Xcode's memory graph debugger - DoorDash
- Memgraph, detection of memory issues on iOS - Halodoc Blog
- GitHub - krzysztofzablocki/LifetimeTracker: Find retain cycles / memory leaks sooner. · GitHub
- Weak self and unowned self explained in Swift - SwiftLee
- iOS 10: Memory Graph Debugger | Kodeco
- Finding cycles with the Memory Graph Debugger with SwiftPM projects - Using Swift - Swift Forums
- Retain Cycles and Memory Leaks in Swift - DEV Community