App Launch Time Optimization Below 400ms on iOS
Most iOS launch slowness hides in framework loading before your code runs.
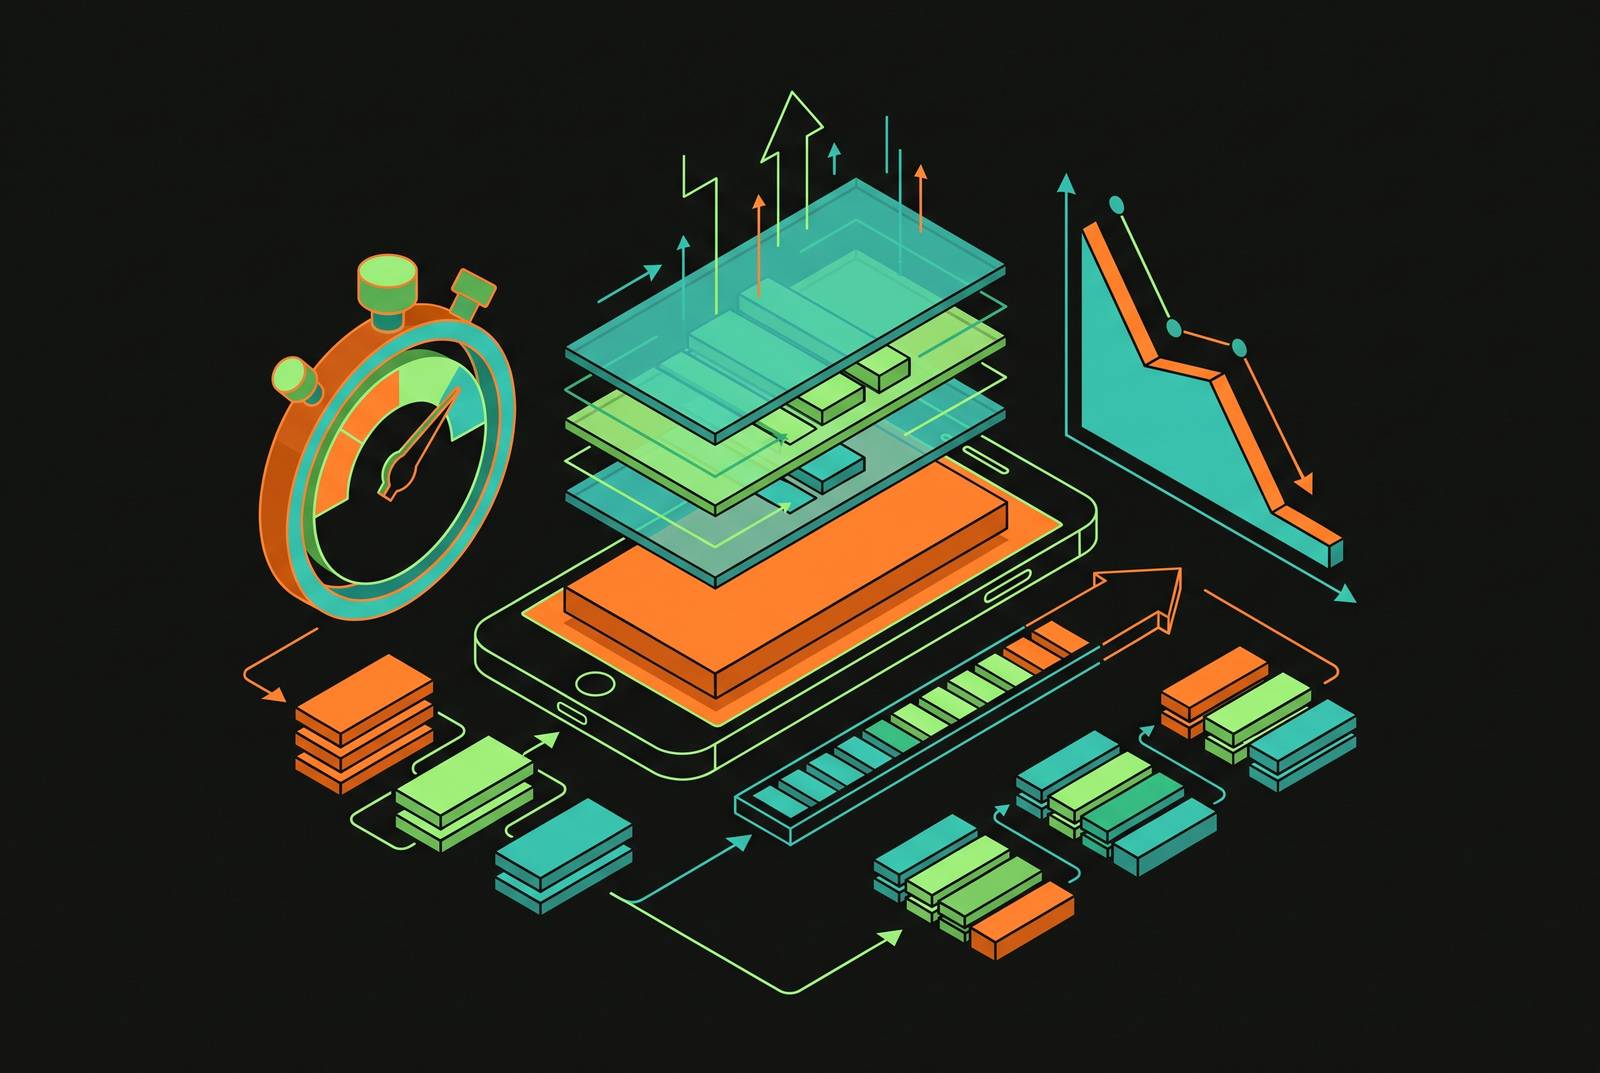
The 400ms launch target on iOS is a direct consequence of how long the app-open animation runs on screen, and the first frame has to be ready before that animation resolves. That timing constraint means no amount of clever work after the animation completes can undo a slow start; the window closes whether or not the app is ready. Of that budget, the system claims roughly 100ms for its own setup, including dynamic linking through DYLD3, leaving the app about 300ms to build its interface and get a frame on screen. Most engineering teams spend their optimization effort in the wrong place, profiling the code that runs after main() is called and tuning view construction, state management, and rendering logic, while the phase that runs before main() goes unexamined. That phase, not the post-main code most teams focus on, is where a large share of the 400ms budget actually gets spent, and it responds to a completely different set of interventions.
The pre-main phase and its recovery limits
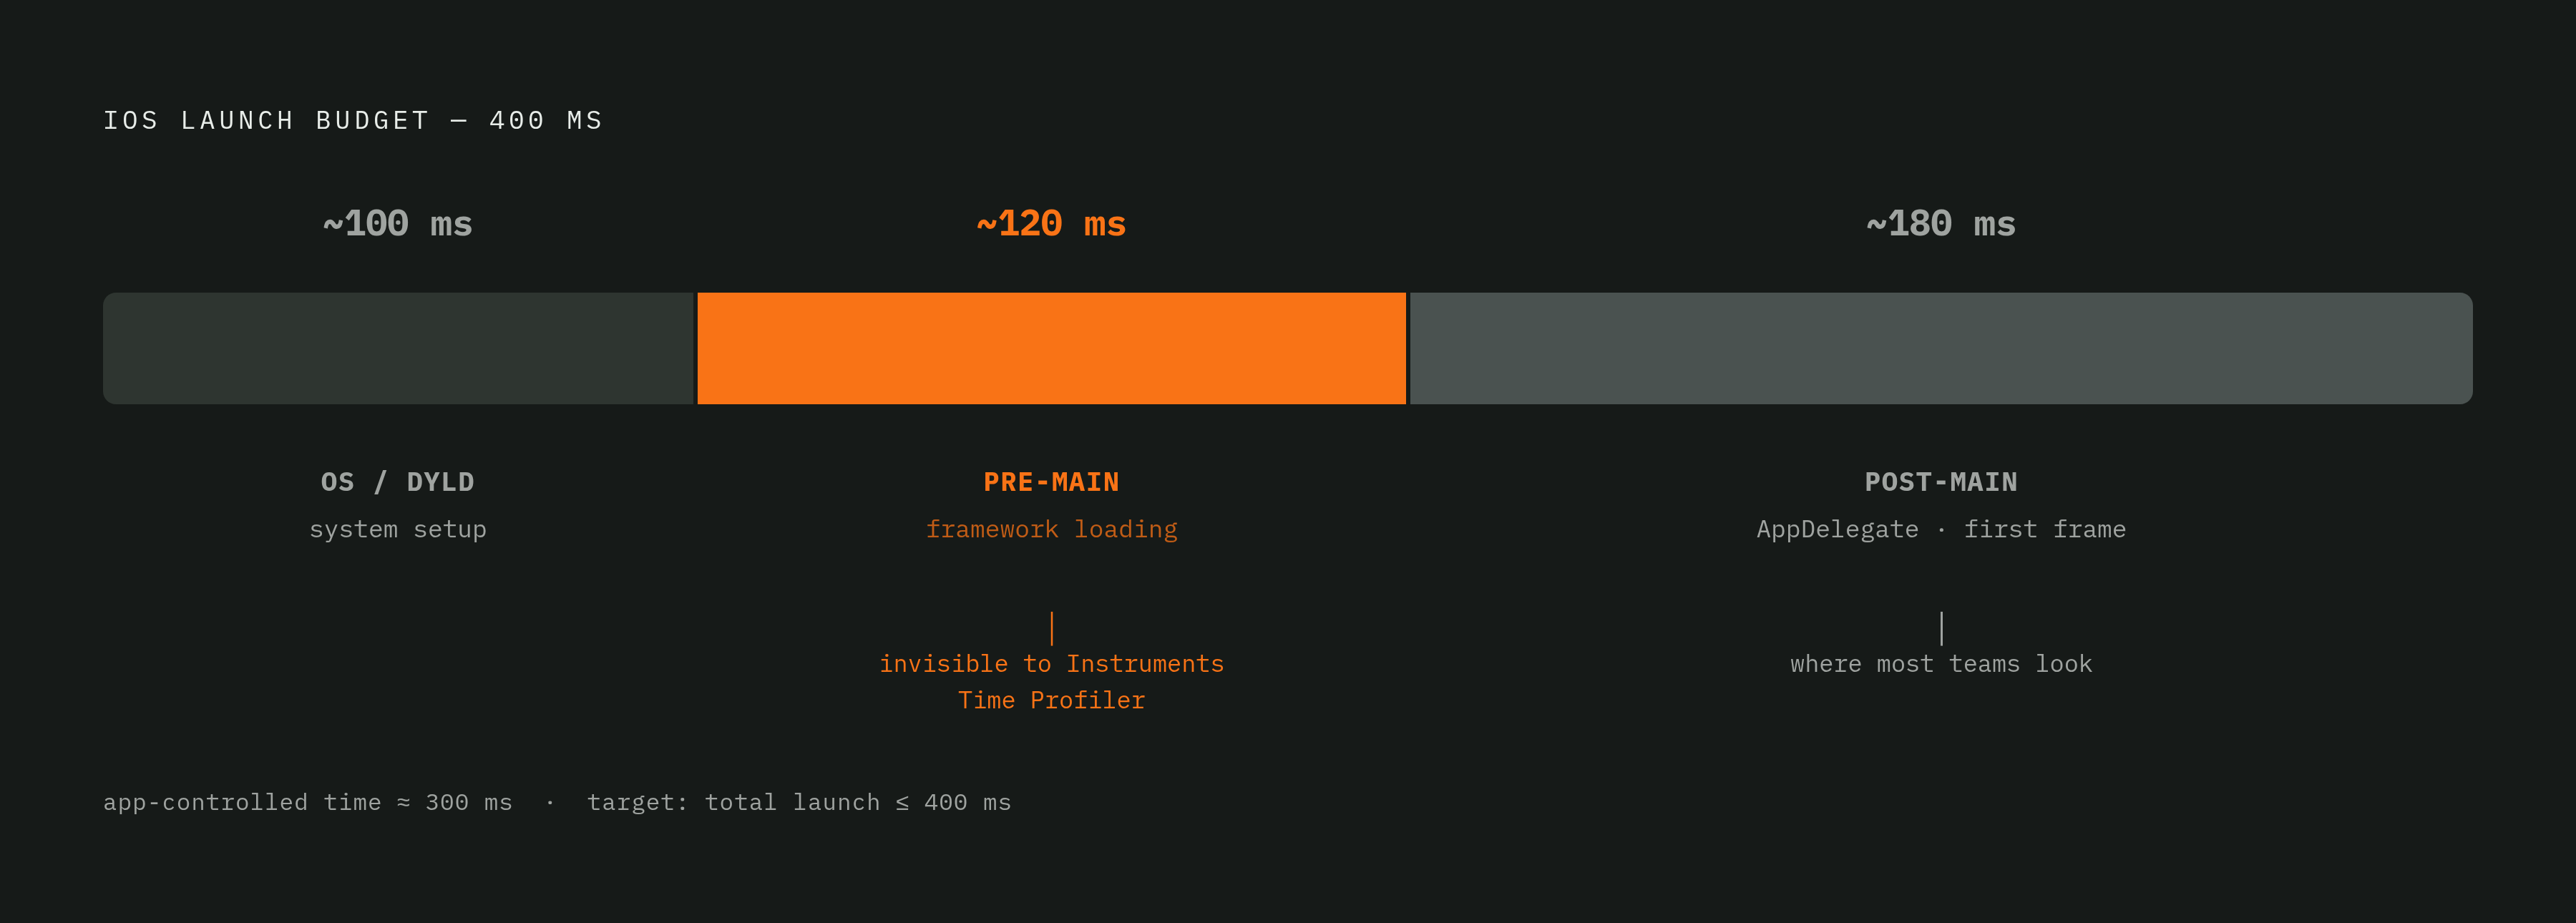
Before an app's own code runs a single line, the operating system has already spent time loading and linking every dynamic framework the app depends on. That work, dominated by dynamic framework loading and early runtime setup, sits outside the app engineer's control in one important sense: nobody on a product team controls the OS linker or the speed at which it resolves dynamic libraries. What the engineer does control is upstream of that: the number and type of libraries that require linking in the first place. Every additional dynamic framework loaded at launch adds directly to dyld link time, and Apple's own WWDC guidance recommends avoiding dynamic library loading during launch altogether, pointing toward static libraries or deferred dlopen calls as alternatives, with the caveat that dlopen used off the startup path carries its own performance costs and is generally discouraged as a workaround. Xcode Instruments' App Launch tool makes this phase visible as a distinct segment, separate from app initialization and first-frame render, and a long pre-main duration is the clearest signal available that a launch is overloaded with frameworks. This is precisely why pre-main is the hardest phase to recover from: a profiler opened after launch will show clean, fast view construction and rendering, while the actual damage has already been done by the time the app's own code begins executing.
Framework surgery as the highest-leverage intervention before the profiler opens
Reducing the number and type of dynamic frameworks an app loads at launch is a decision made in the dependency graph, not in a flame graph, and it produces the most durable gains available before any other optimization is attempted. One documented case illustrates the scale of the problem: a team found 23 third-party frameworks loading at launch regardless of whether the user's session required them, including five separate analytics SDKs initializing simultaneously. That kind of overhead is invisible to a post-main profiler session, because by the time that tool starts measuring, the frameworks have already loaded. The team's sprint on an app that was launching slowly on mid-range devices found framework reduction to be irreversible in the useful sense: once a static library replaces a dynamic framework, every subsequent launch benefits with no ongoing maintenance cost required to sustain the gain. The most common objection to this approach is that many third-party SDKs ship only as dynamic frameworks and cannot be converted to static form. The fix is to audit whether each SDK is actually needed and consolidate redundant ones: five analytics libraries running at once reflects a failure of product governance rather than a technical constraint engineering has to work around. These figures come from a single documented team's sprint on a specific app, and they should be read as representative of the pattern rather than as a universal benchmark every app will hit.
AppDelegate structure and initialization order as the post-main chokepoint
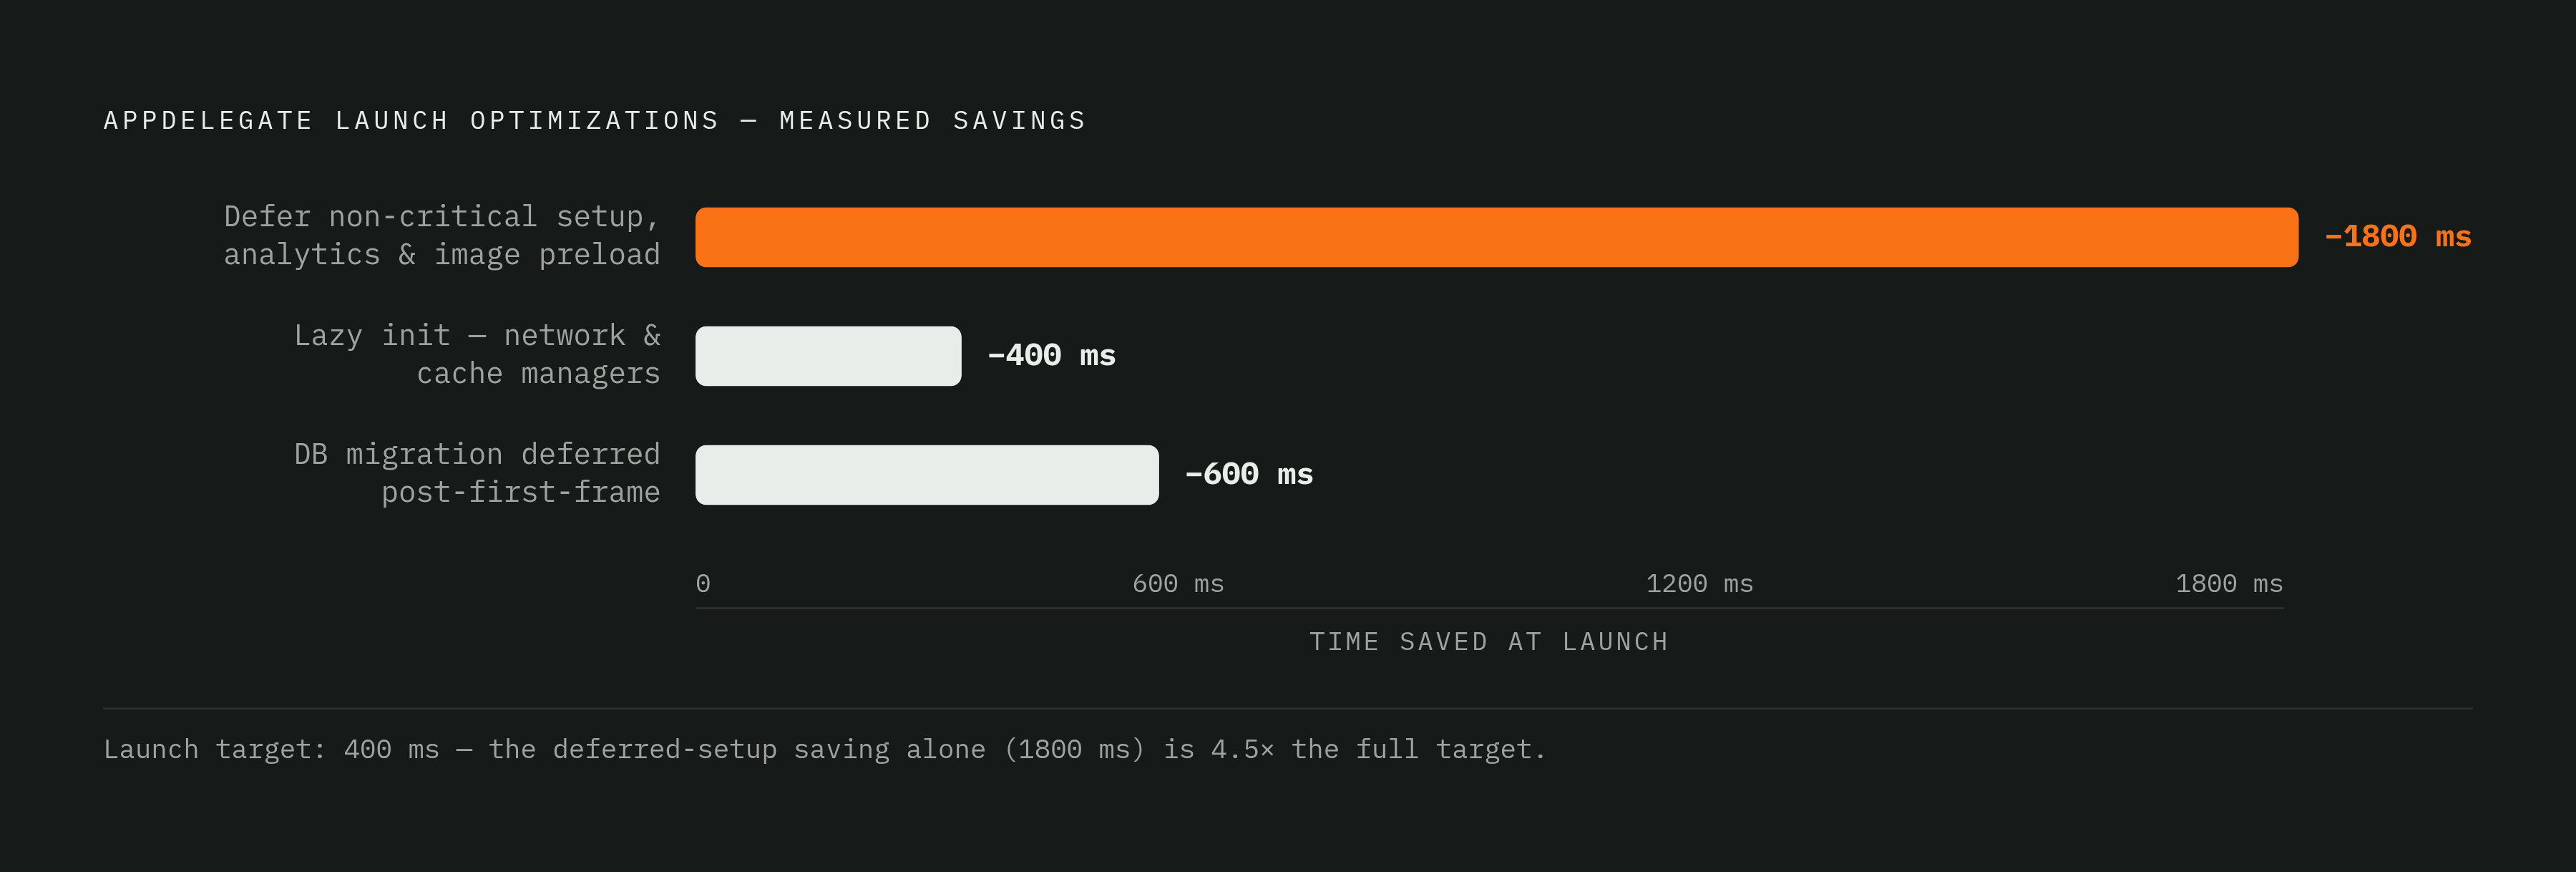
Once pre-main is clean, the next architectural bottleneck is AppDelegate. After the linker finishes its work, the main thread runs didFinishLaunchingWithOptions synchronously, and any work placed inside that method blocks the thread before a single pixel of the app's interface is drawn. Common patterns that block the main thread at this stage: analytics and crash-reporting SDK setup called eagerly and synchronously, database migration triggered unconditionally on every launch, and synchronous disk reads for user defaults, cache, or preferences run directly on the main thread. One documented case showed the main thread blocked for several seconds during launch from exactly this combination of causes. The structural fix in each case is deferral: work that does not affect the first frame should not run before the first frame appears. Moving non-critical setup, analytics, remote configuration, and image preloading onto a background queue, or delaying it with a short asyncAfter call, saved roughly 1.8 seconds in one documented case. Switching service objects like network managers and cache managers to lazy initialization means their cost is paid only when a service is first accessed rather than unconditionally at launch, which saved roughly 400ms in the same sprint. Guarding database migration behind a schema-version check and running it after the first screen appears, on a background queue, saved roughly 600ms. None of these are tricks. Each reflects a judgment about what the first frame genuinely requires, distinguishing that from what a team has habitually placed at launch simply because AppDelegate was the first convenient place to put it. Making that distinction correctly, rather than defaulting to eager setup out of habit, is the kind of judgment that separates senior engineering work from mid-level work on a launch path.
How initialization order errors compound
Initialization order errors are often harder to catch than a blocked main thread because they don't produce a crash or an obvious stall. They produce launch times that quietly inflate, look acceptable during development on current hardware, and degrade in production on older devices. One development team reported, in a case from 2026, a cold launch time reduction of roughly 80% achieved by reversing an incorrect initialization order that a senior engineer identified, replacing eager sequential setup with lazy loading and asynchronous initialization. The mechanism behind this kind of compounding cost is straightforward once traced: if dependency A initializes B synchronously, and B in turn initializes C, and C performs disk I/O, the full cost of that entire chain is paid at launch even when B and C are not actually needed until the user reaches a second screen. That chain stays invisible without a deliberate audit of the dependency graph, because no single component in isolation looks expensive. The architectural principle that resolves this is a shift from push-based initialization, where objects are constructed because AppDelegate happens to run top to bottom, to pull-based initialization, where objects are constructed only when first accessed. Global singletons initialized at load time are the most common expression of the push-based pattern, and they are deceptive precisely because they appear harmless: they look stateless until used, but their constructors still run at launch regardless of whether that instance is ever touched during the session. Fixing this requires treating initialization order as a system-level property of the app's architecture, applied consistently rather than tuned line by line wherever a profiler happens to point.
Measuring pre-main to first frame in production, not just in the lab
A single flame graph captured in Instruments cannot reliably stand in for production launch performance. A launch that measures 400ms on a current-generation device can run closer to 2 seconds on older hardware under thermal load or memory pressure, and the real distribution of users skews toward that older hardware rather than the device sitting on an engineer's desk. Practitioner consensus holds that P95 percentiles, not lab measurements taken on a handful of devices, should drive and prioritize mobile performance work, and the 400ms figure itself is best understood as a P50 target on modern hardware, with P95 performance on the oldest device a team still supports serving as the actual production gate. Apple's MetricKit framework tracks MXAppLaunchMetric using the same figures Apple's own internal performance teams rely on, and current industry guidance identifies MetricKit paired with Xcode Organizer as the primary instrumentation layer for this kind of measurement, since it is free, privacy-preserving, and built natively into the platform, with a tool like Firebase Crashlytics serving as a secondary layer for alerting. That instrumentation layer feeds into four production metrics that together describe the complete picture of iOS app quality. Crash-free session rate, readable from Crashlytics, Sentry, or Xcode Organizer, carries a well-defined excellent threshold and a red-zone floor below which a release should not ship. Hang rate is the frequency of main-thread blocks above a short duration threshold, and it is readable from MXAppResponsivenessMetric and Organizer's Hangs report, with its own excellent and red-zone bands. Animation hitches, measured per frames rendered through MXAnimationMetric, round out the picture with thresholds of their own. The practical consequence of skipping this layer of measurement is straightforward: a team that profiles only in the lab will ship believing it hit the 400ms target, then discover through MetricKit that P95 launch time in production runs three times longer on the devices its actual users carry.
SwiftUI's initialization model and launch budget
SwiftUI introduces a small but measurable cold-launch cost relative to UIKit. A benchmark run on iPhone 15 Pro shows a real but narrow gap between the two frameworks, a gap that is not the primary lever available to most teams trying to hit launch-time targets. Heavy view bodies evaluated before the first frame renders add directly to main-thread time during the post-main phase, so WWDC 2025 placed explicit emphasis on view body optimization and state management efficiency and introduced a dedicated SwiftUI Performance Instrument to surface this cost. Swift 6's strict concurrency model changes the reliability calculus around launch in a structural way. Compile-time data-race detection eliminates a meaningful share of the hard-to-reproduce crashes that teams previously had to debug at runtime, and those crashes disproportionately manifested during the launch sequence, since initialization races are most likely to fire exactly when multiple setup paths run concurrently. WWDC 2025 detailed how Swift 6.2 extends this further: SwiftUI views are now implicitly isolated to the main actor through the View protocol, and an opt-in module-level setting under SE-0466 can make main-actor isolation the compile-time and runtime default across an entire app module, removing a class of manual annotation errors that used to cause unpredictable threading behavior during launch. None of this argues against UIKit where launch-critical precision is required.
On-device AI model loading as the emerging pre-main threat
On-device AI introduces a new category of launch-time risk that follows the same discipline as framework loading, applied now to model weights instead of dynamic libraries. Apple's Foundation Models framework, which shipped at WWDC 2025, and Core AI, which followed at WWDC 2026 with support for on-device inference of language models in native Swift and no server dependency, make model loading a first-class initialization concern. Engineers who treat model setup as something to push onto a background task after launch will find that it carries its own startup cost, one that has to be reasoned about explicitly rather than assumed away. The Foundation Models framework's on-device inference path delivers zero network latency, full offline support, and a type-safe Swift API by design, and those properties make it attractive for product features. That same design is what makes model loading dangerous to place carelessly in the launch sequence: a large model initialized eagerly, the same way an over-eager singleton or an unconditional database migration once was, will consume main-thread time before the first frame renders, recreating the pre-main framework problem in a new form. The discipline that fixed dynamic framework overload, reducing what loads eagerly, deferring what is not immediately needed, and auditing the dependency graph before opening a profiler, applies just as directly to on-device model initialization as it did to third-party SDKs.