Battery Impact Profiling With Energy Log and MetricKit
Apple moved battery profiling from the lab to production with two complementary tools.

iOS now shows users exactly which app is draining their battery, and that single interface change moved responsibility for power consumption from Apple's shoulders onto the developer's. Before this, a user who noticed their phone dying by noon had no easy way to trace the cause, so Apple or "the device" absorbed the blame. Before this visibility shift, users blamed the device or the OS; now they identify and uninstall the offending app. Apple backs this with policy: Guideline 2.4.2 permits App Store rejection for excessive battery usage, so a drain problem isn't just a retention risk anymore but a possible blocker to shipping at all. Battery efficiency has moved from a performance nicety to a basic condition of being allowed on a user's phone.
Why one tool cannot cover the whole problem
Battery drain splits into two categories that share almost nothing in common except the symptom. One category can be reproduced at a desk: a CPU spike tied to a specific code path, a background task that wakes the device too often, an excessive wake-up pattern triggered by a known user action. Drain that appears on one device tier, in one region, or under a usage pattern no QA script ever anticipated is visible only once an app is in the hands of thousands of real users on real hardware. No single instrument catches both, because the first category needs controlled, repeatable conditions and the second needs aggregated signals from a fleet too large and too varied to simulate.
This is a structural gap rooted in how battery drain behaves across different testing phases. Traditional QA is built to catch crashes and interface bugs, both of which tend to announce themselves immediately and consistently. Battery drain doesn't behave that way: it can pass every test in a CI/CD pipeline cleanly and only reveal itself weeks later in App Store reviews. Teams that profile only before shipping will ship regressions they have no way of seeing. Teams that wait for production signals will catch problems only after users have already started leaving. Apple's own answer to this is a toolchain built in layers rather than a single product: Energy Gauges and Power Profiler for the development phase, XCTests for ongoing automated checks, and Xcode Organizer, MetricKit, and the App Store Connect API once the app is live. Each layer exists because the layer before it cannot see everything.
Energy Log (Instruments)
Energy Log, inside Instruments, is built for exactly the first category: a battery regression that can be reproduced in a session at a desk. It doesn't just flag that energy use spiked. It returns symbolicated backtraces tied to the specific event, so the code path responsible for the spike is identifiable rather than guessed at. Running it is straightforward: Xcode, Product, Profile, Energy Log, on a physical device, since simulators don't return accurate energy numbers. What it captures spans CPU usage spikes, network activity patterns, wake-up frequency, background processing duration, and location services use, giving a fairly complete picture of where an app is spending power during the recorded window.
The Power Profiler, introduced in Instruments at WWDC 2025, sits between the coarse, real-time feedback of Xcode's Energy Gauges and the post-ship view MetricKit provides, and Apple now positions it as the tool for pre-ship deep analysis. It shows system-level power metrics alongside per-app power impact, covering CPU, GPU, display, and networking, in one trace view rather than scattered across separate panels. A concrete case from that same session makes the value of this legible: a CPU power impact score jumped from a baseline of 1 to 21 the moment a Library pane was opened, a jump large enough to make clear something specific in that interaction was responsible. Finding what, specifically, meant pairing the Power Profiler with Time Profiler's Call Tree and Heaviest Stack Trace views, moving from "high CPU power impact" to the specific function responsible. That's the full diagnostic chain: a visible spike in a normalized score, then a stack trace that turns "something is wrong" into "this function is wrong."
Profiling doesn't require a tethered Mac at every step. Developer Mode, enabled on the device itself, exposes a Performance Trace icon in Control Center that can capture extended monitoring sessions and export trace files for review by anyone on the team, including QA members who never need Xcode open. For teams that want this automated, the Instruments CLI supports a direct command: [instruments -t "Energy Log" -D energy_trace.trace -w <device_udid> <app_bundle_id>](https://www.pcloudy.com/blogs/battery-drain-testing-for-mobile-apps/), which becomes the hook for folding energy profiling into a CI/CD pipeline. Energy Log has a hard boundary, though. It only works on problems that reproduce inside a session. Thermal behavior that builds over hours, drain tied to a specific network condition, or a regression that only appears on one device tier will not appear no matter how carefully the session is run.
What MetricKit captures that Energy Log cannot
MetricKit covers exactly the ground Energy Log cannot reach: structured battery and performance data pulled from real devices, in real conditions, at fleet scale. Every 24 hours, iOS assembles an MXMetricPayload covering CPU usage, memory footprint, disk I/O, network activity, launch times, and battery consumption, and delivers it to any app that has registered an MXMetricManagerSubscriber. The framework defines two distinct payload types built for different purposes, with the metric payload serving as the daily aggregated report across battery, performance, responsiveness, and disk access.
Compared to a third-party analytics SDK, MetricKit has a few structural advantages that are hard to replicate independently. There's no integration overhead to speak of, no binary size added to the app, a privacy-first design by default, and access to system-level metrics such as energy impact and cellular usage that sit outside what any third-party tool can reach. Every payload carries MXMetaData alongside it, which supplies device type, OS version, app build version, and region, turning a raw aggregate number into something that can actually be traced to a cause. Setting it up takes only a few steps: import MetricKit, add the framework to the Xcode target, implement didReceive(_ payloads: MXMetricPayload) on a subscriber, and call MXMetricManager.shared.add(self). Both payload types can be represented as JSON or as a dictionary, which makes it straightforward to upload them to a custom API endpoint and build dashboards tracking trends across builds. The framework has been available since iOS 13, with crash and hang diagnostics added in iOS 14, and immediate delivery of MXDiagnosticPayload on crash or CPU exception arriving in iOS 15.
How the Two Layers Fit Together as a Workflow
Energy Log and MetricKit aren't competing options for the same job. They sit at different points in the development cycle, and each one makes the other more useful rather than redundant. The sequence starts before a feature ships: Energy Log and Power Profiler catch regressions during development, which is also the right point to set a power budget for a feature and compare competing implementations before any of them get merged. Comparing implementations has a specific shape to it: establish a baseline profile of what already exists, profile each candidate approach under identical conditions, control for thermal state and device condition, run each candidate multiple times, and judge based on net power impact across CPU, GPU, and networking together rather than any single subsystem in isolation.
Once that feature ships, the workflow hands off to production. MetricKit's applicationEnergyMetrics, delivered in the daily payload, becomes the new baseline for that feature, and a jump in that number across builds is the signal to reopen Energy Log and start a new investigation cycle. A regression visible in the fleet sends the engineering team back to the desk-level tool built to isolate it, which is the connective tissue of the whole system. CI/CD integration ties both ends together directly. Energy Log run through the Instruments CLI builds baseline energy profiles for key user scenarios and compares them across builds, catching regressions before anything ships, while MetricKit's subscriber pattern covers the post-ship verification side. On-device profiling through Control Center extends the pre-ship layer further still, letting QA and field testers capture hours of real-world usage without a tethered Mac, before MetricKit takes over once the app is actually in users' hands. Develop, profile, ship, monitor, investigate: that loop, run continuously, is what makes this a workflow rather than two separate audits performed at different times for different reasons.
The 24-hour latency objection
A fast-moving engineering team has a fair objection to raise here: MetricKit's metric payload only arrives once every 24 hours, and a team shipping multiple builds a week can reasonably ask whether that's too slow to be useful. The constraint applies only to one layer of what MetricKit reports, the aggregated trends layer, not the crash and critical-event layer. MXDiagnosticPayload fires immediately on crash and CPU exception events since iOS 15, which closes the gap for exactly the regressions that need the fastest response.
The daily window exists because it's suited to what it's measuring. Fleet-wide energy trends are statistical patterns, not incidents demanding a real-time alert, and comparing one build's daily payload against the prior build's is the right resolution for spotting a regression in a trend line. The workflow resolves the objection by assigning each tool to the window it's actually built for: Energy Log covers pre-ship detection, where speed matters most, and MetricKit covers post-ship verification and fleet-wide trending, where a 24-hour cadence is the correct cadence rather than a compromise. Teams shipping at the velocity of an Apple or a Lululemon should treat MXDiagnosticPayload's immediate delivery as the signal for critical regressions in production, and MXMetricPayload as the slower trend layer underneath it, not the reverse.
A second limitation deserves equal attention. Energy regressions tied to on-device AI features can be confined to specific device tiers, and if fleet-wide data gets aggregated without segmenting by the device type carried in MXMetaData, those regressions disappear into the average rather than standing out. For any product running on-device model inference, segmenting the backend dashboard by device tier isn't an optional refinement. Segmenting by device tier is the only way those regressions become visible at all.
React Native Fitness App Case: Battery Drain Root Causes
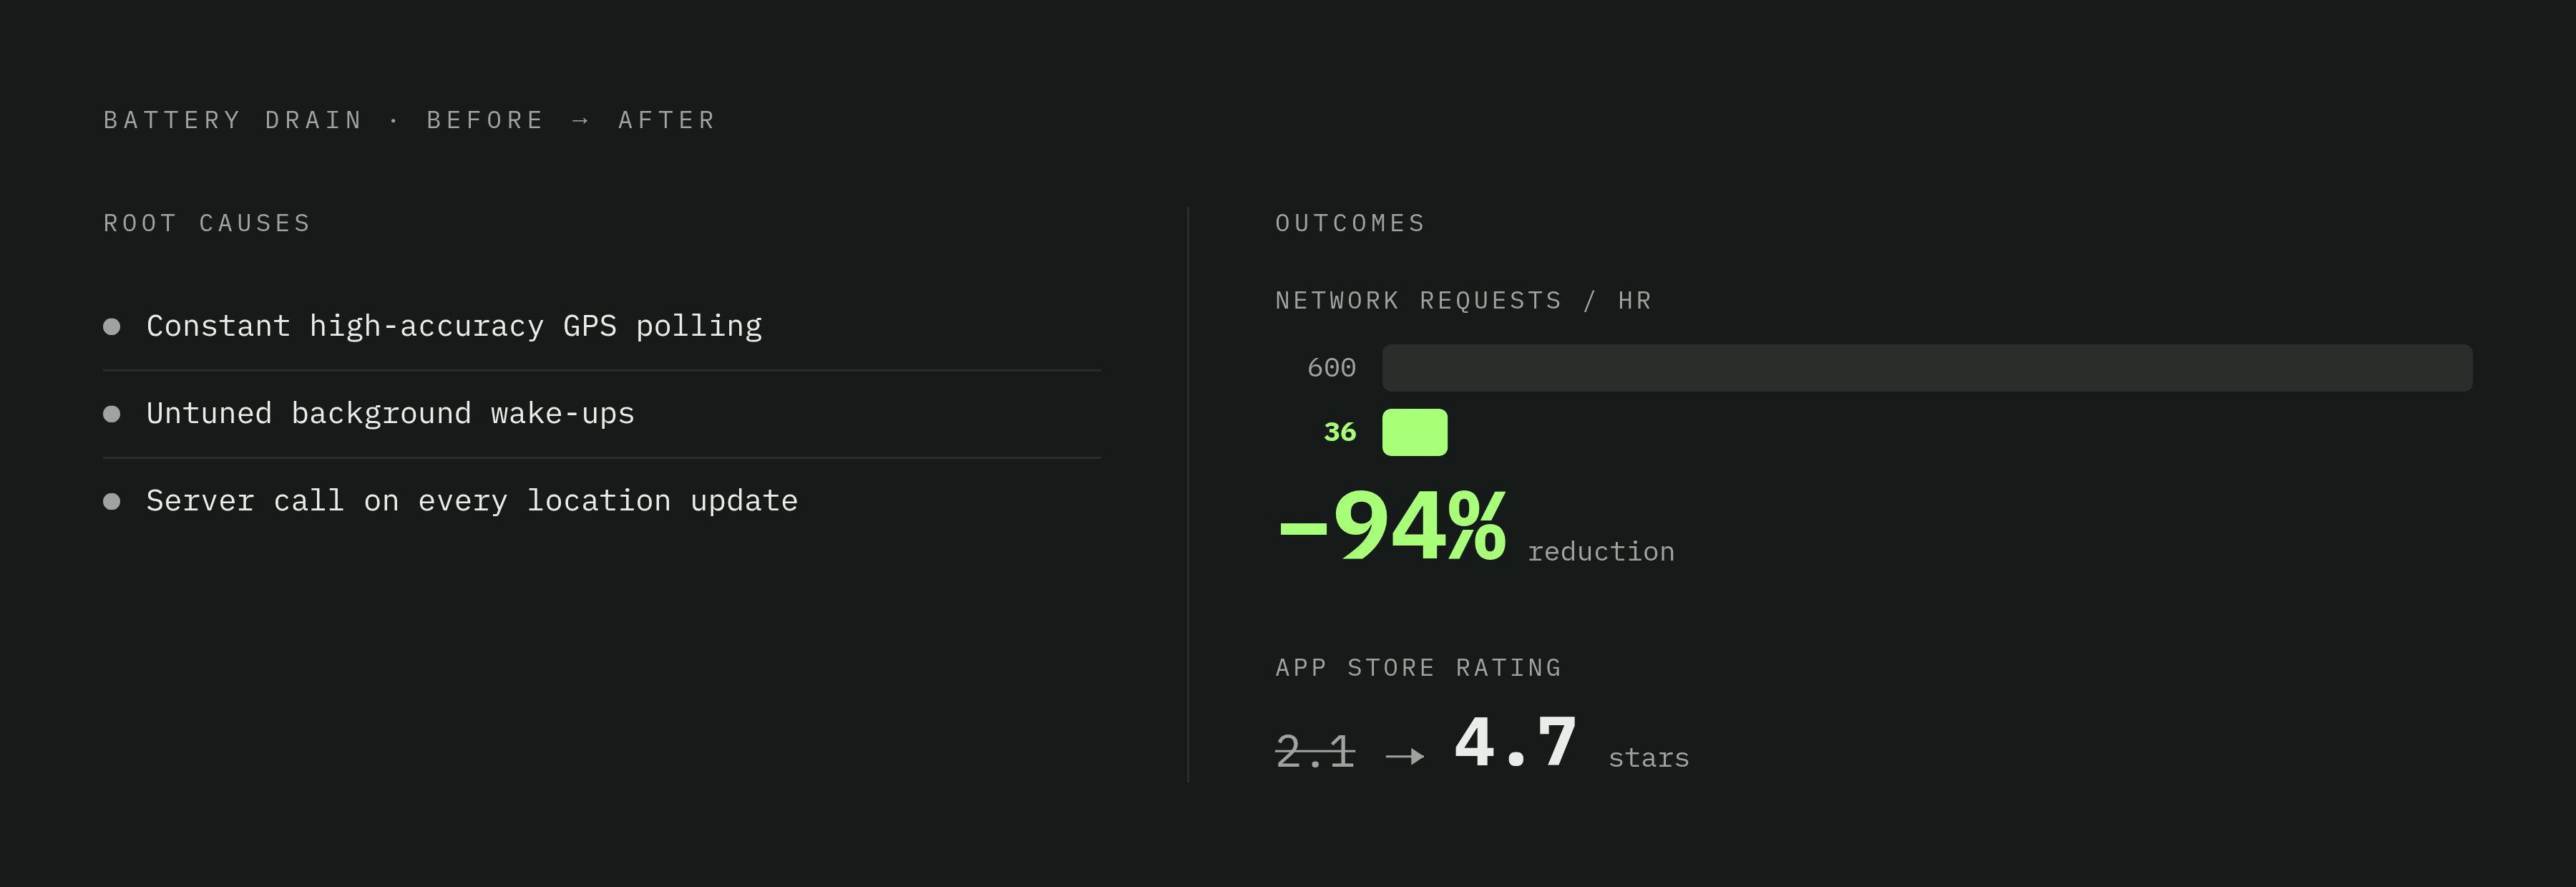
Most battery drain traces back to a small, recognizable set of causes: constant high-accuracy sensor polling, background wake-ups nobody optimized, and API calls fired far more often than needed. None of these are architecture failures. They're measurement failures, the exact kind the two-layer workflow exists to catch before a user ever notices.
A React Native fitness app illustrates this with unusual clarity. It was draining battery heavily during GPS-tracked workouts, and the root causes were constant high-accuracy GPS polling, background wake-ups that were never tuned, and a server call fired for every single location update. After those changes shipped, drain during a 30-minute workout dropped substantially, network requests fell from 600 to 36 per hour, a 94% reduction, and App Store ratings climbed from 2.1 to 4.7 stars.
Every root cause in that list maps directly onto the two-layer workflow described above. High-accuracy GPS polling and a tight loop of API calls are precisely what Energy Log's wake-up frequency and network activity lanes are built to flag during pre-ship profiling, and the fleet-wide improvement after the fix shipped is exactly the kind of signal that would show up in MetricKit's applicationEnergyMetrics. The React Native layer adds its own complication: iOS support for React Native's background actions is limited and carries aggressive battery usage warnings, and the JavaScript-native bridge adds overhead that native MXMetricManager subscription sidesteps entirely, since native iOS code can subscribe to energy metrics in-process with no bridging cost. The business consequence wasn't abstract. Battery complaints accounted for a large share of the app's 1-star reviews before the fix, and nearly vanished afterward, which is the same retention signal the opening section described, playing out in a single, measurable case.
On-Device LLMs and Battery Profiling as a First-Class Engineering Discipline
App developers are now directly accountable to users for battery drain because iOS surfaces per-app battery consumption in Settings, making the cause visible and attributable in a way it was not before iOS 8. A model running inference locally draws power in patterns that differ by chip generation and device tier. This means the fleet-wide masking risk described earlier, drain hidden by averaging across device types, becomes more likely rather than less whenever a feature depends on local inference. The two-layer workflow doesn't need to be replaced to handle this. It needs to be applied with more discipline: Energy Log profiling runs before any inference feature ships, and MetricKit dashboards segment by device tier as a baseline requirement, not an enhancement added later. Under these conditions, battery profiling becomes an ongoing discipline tracked release over release, the same way crash-free rate or app launch time already are.